How it works
The whole system

Description
The I.E.Q.A. system consists of spatially distributed autonomous base stations equipped with sensors, LCD display, actuator, data storage device and a board that supports a Linux distribution with built-in WiFi support. Every single base station is able to send their acquired/stored data over WiFi in a Wireless Local Area Network (WLAN) to a virtual Linux server which is aimed to process and display data through a dedicated web application. The latter, processes the data using a mathematical model based on the combination of two parameters: HI, which is obtained by multiple regression analysis by considering the values of temperature and relative humidity, and LBI that provides an index based on the detected brightness and taking into account the UNI EN 12464 (released by the Italian National Unification).
For more details explore the following sections:
Functionalities
Main server functionalities:
- Dashboard
show in real time the relevant data using charts and tables to illustrate the most important informations.
- Graphs
show in real time detailed graphs in order to analyze data.
- Statistics
show in real time statistics, boxplots and graphs to make statistical analysis of data.
- Report
uses the processed data to make statistical report.
- Options
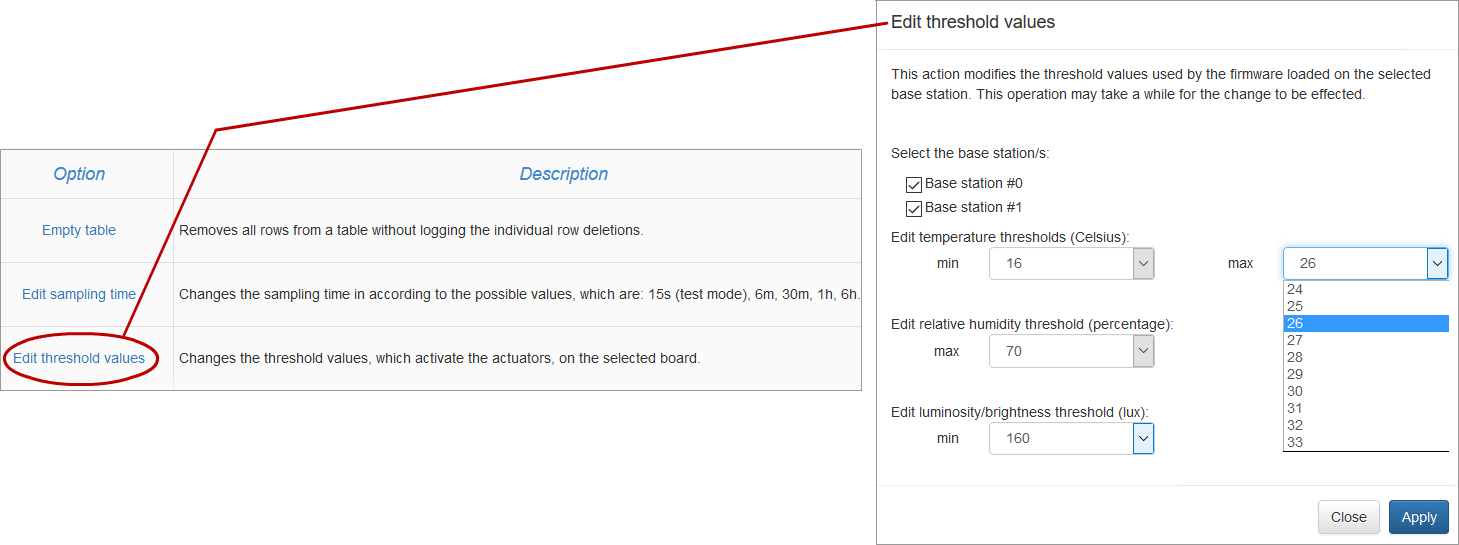
it is possible to edit/apply various option (see functionalities for the user).
Main functionalities for the user:
- Empty the table
possibility to truncate through a SQL query of the database table which contains the all acquired values.
- Setting the sampling rate
possibility to set the time interval between two consecutive acquisitions on the desired base station/s.
- Setting the alarm thresholds
possibility to set the alarm thresholds range for each sensor (temperature, relative humidity and brightness/luminosity) on the desired base station/s.
Main functionalities of every base station:
- Connection
connection to the WLAN network with a static IP.
- Time synchronization
the device can synchronize its clock time with the server.
- Storage device
in offline mode the acquired data are storaged into a microSD card. The stored data will be sent to the server at the reconnection.
- Programmable
it is possible to change the firmware code reguarding alarm thresholds and sampling rate from the server.
- Actuator
the device has been predisposed to easily drive an actuator.
- Diagnostics
the device can easily recognize if sensors don't work or are disconnected.
- LCD and Reset
endowed with a reset button and a display with backlight that displays all informations about the system.
Network

Network configuration
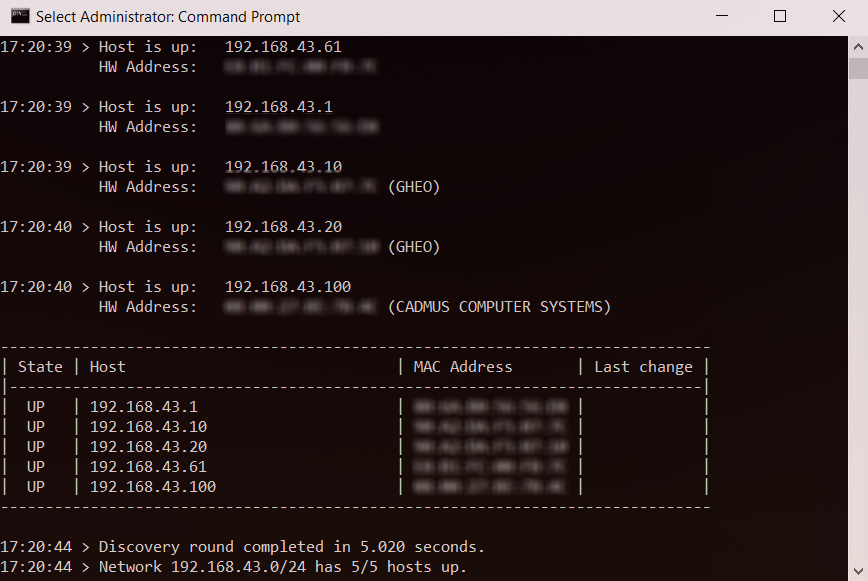
In the following table it can be seen the network configuration of the whole system
| Base station #0 | Base station #1 | Host | Virtual web server | |
|---|---|---|---|---|
| Address | 192.168.43.10 | 192.168.43.20 | 192.168.43.61 | 192.168.43.100 |
| Netmask | 255.255.255.0 | 255.255.255.0 | 255.255.255.0 | 255.255.255.0 |
| Wildcard mask | 0.0.0.255 | 0.0.0.255 | 0.0.0.255 | 0.0.0.255 |
| Network | 192.168.43.0/24 | 192.168.43.0/24 | 192.168.43.0/24 | 192.168.43.0/24 |
| Broadcast | 192.168.43.255 | 192.168.43.255 | 192.168.43.255 | 192.168.43.255 |
| Gateway | 192.168.43.1 | 192.168.43.1 | 192.168.43.1 | 192.168.43.1 |
This configuration lets available a number of hosts equal to H = 28 − 7 = 249 hosts.
Thus there is the possibility to extend the number of base stations BS up to BS = H − U where U = ∑i ui users.
Communication
The base stations have built-in a WiFi interface which supports IEEE 802.11 b/g/n standard compliant 2.4GHz as described in the table (supporting WEP, WPA and WPA2 encryption).
| Standard | Frequency | Bandwidth | Modulation | Range (approx.) |
|---|---|---|---|---|
| 802.11 b | 2.4 GHz | 22 MHz | DSSS | 35 m |
| 802.11 g | 2.4 GHz | 20 MHz | OFDM | 35 m |
| 802.11 n[1] | 2.4 GHz | 20 MHz | MIMO-OFDM | 70 m |
[1] The standard 802.11 n supported by the base stations.
The standard communications protocol used to share informations and data, is the Hypertext Transfer Protocol (HTTP) making use of the following two methods:
- HTTP GET
-
The GET method requests a representation of the specified resource. Requests using GET should only retrieve data and should have no other effect.
This method is used by the base stations to get the updated values of alarm thresholds and sampling rate or to syncronize the clock of the Linino kernel with the server. - HTTP POST
- The POST method requests that the server accept the entity enclosed in the request as a new subordinate of the web resource identified by the URI.
This method is used by the base stations to post data (acquired or stored into the microSD card) to the server.
Server virtualization
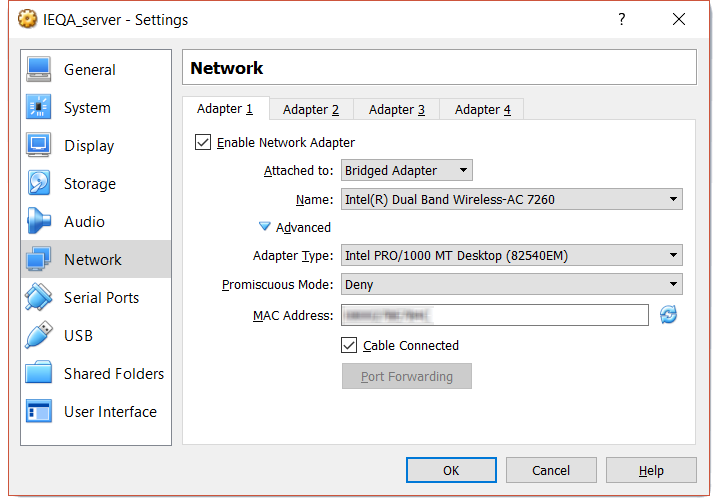
In order to virtualize the web server, it has been used Oracle VirtualBox (freely available as Open Source Software under the terms of the GNU General Public License version 2) which is a cross-platform virtualization application. Thus, it has been installed a Debian-based Linux operating system named "Ubuntu Server" used as LAMP server with no GUI. To implement the connection properly, it has been used the bridged network between host and server (guest). In this mode, the guest system will receive direct access to the network, to which the host system has been connected.
Bridged network (more in detail)
With bridged networking, VirtualBox uses a device driver on the host system that filters data from the physical network adapter. This driver is therefore called a "net filter" driver and it allows VirtualBox to intercept data from the physical network and inject data into it, effectively creating a new network interface in software. When the guest is using such a new software interface, it looks to the host system as though the guest were physically connected to the interface using a network cable: the host can send data to the guest through that interface and receive data from it. From the following screenshots it can be seen the network settings of the server on VirtualBox and the network configuration detected on the Host.
Hardware
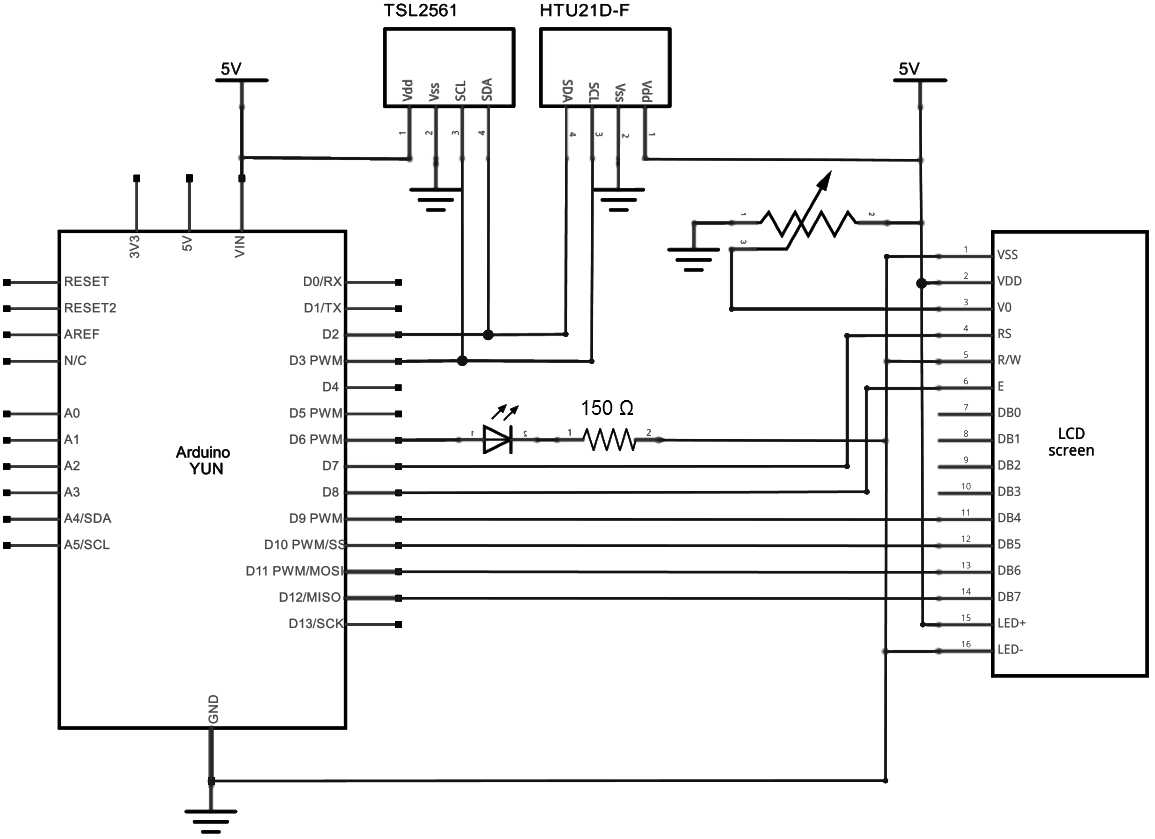
This is a list (with a brief description) of the hardware used to make a single base station:
Arduino Yún
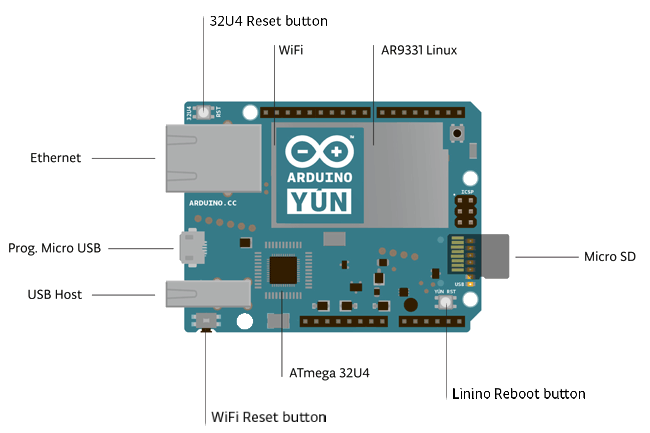
The Arduino Yún is the core of the base station, which is a microcontroller board based on the ATmega32u4 and the Atheros AR9331. The Atheros processor supports a Linux distribution based on OpenWrt named OpenWrt-Yun.
The board has built-in Ethernet and WiFi support, a USB-A port, micro-SD card slot, 20 digital input/output pins (of which 7 can be used as PWM outputs and 12 as analog inputs), a 16 MHz crystal oscillator, a micro USB connection, an ICSP header, and a 3 reset buttons.
The Yún distinguishes itself from other Arduino boards in that it can communicate with the Linux distribution onboard, offering a powerful networked computer.
For more details see Arduino website.
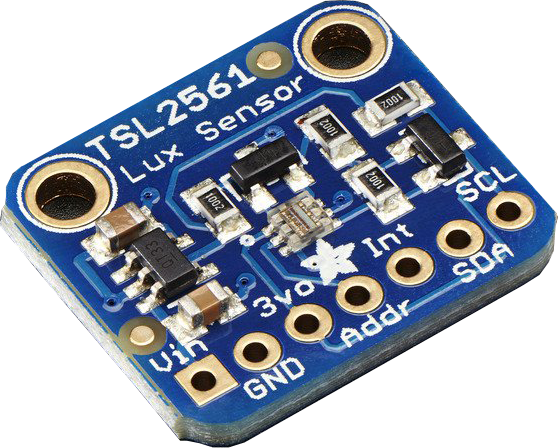
Luminosity sensor TSL2561
The TSL2561 luminosity sensor is an advanced digital light sensor, ideal for use in a wide range of light situations. This sensor is very precise, allowing for exact lux calculations and can be configured for different gain/timing ranges to detect light ranges from up to 0.1 - 40000+ Lux on the fly.
The sensor contains both infrared and full spectrum diodes, which means it is possible to measure infrared, full-spectrum or human-visible light separately.
The sensor has a digital (I2C) interface. The current draw is extremely low, so its great for low power data-logging systems, about 0.5 mA when actively sensing, and less than 15 uA when in powerdown mode.
For more details see Adafruit website.
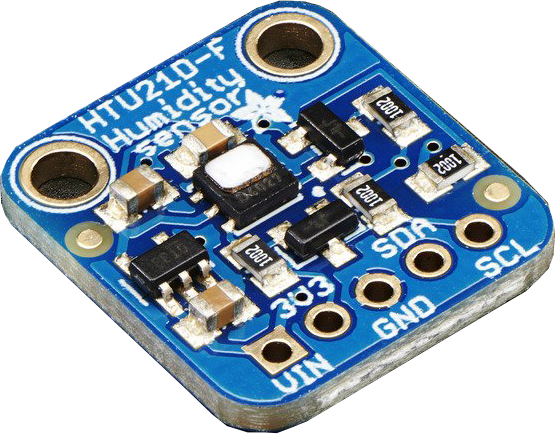
Humidity and Temperature sensor HTU21D-F
This I2C digital humidity sensor is an accurate and intelligent alternative to the much simpler Humidity and Temperature Sensor. The temperature output has an accuracy of ±1°C from -30∼90°C. This sensor can work with any kind of microcontroller with 3.3V-5V power or logic.
For more details see Adafruit website.
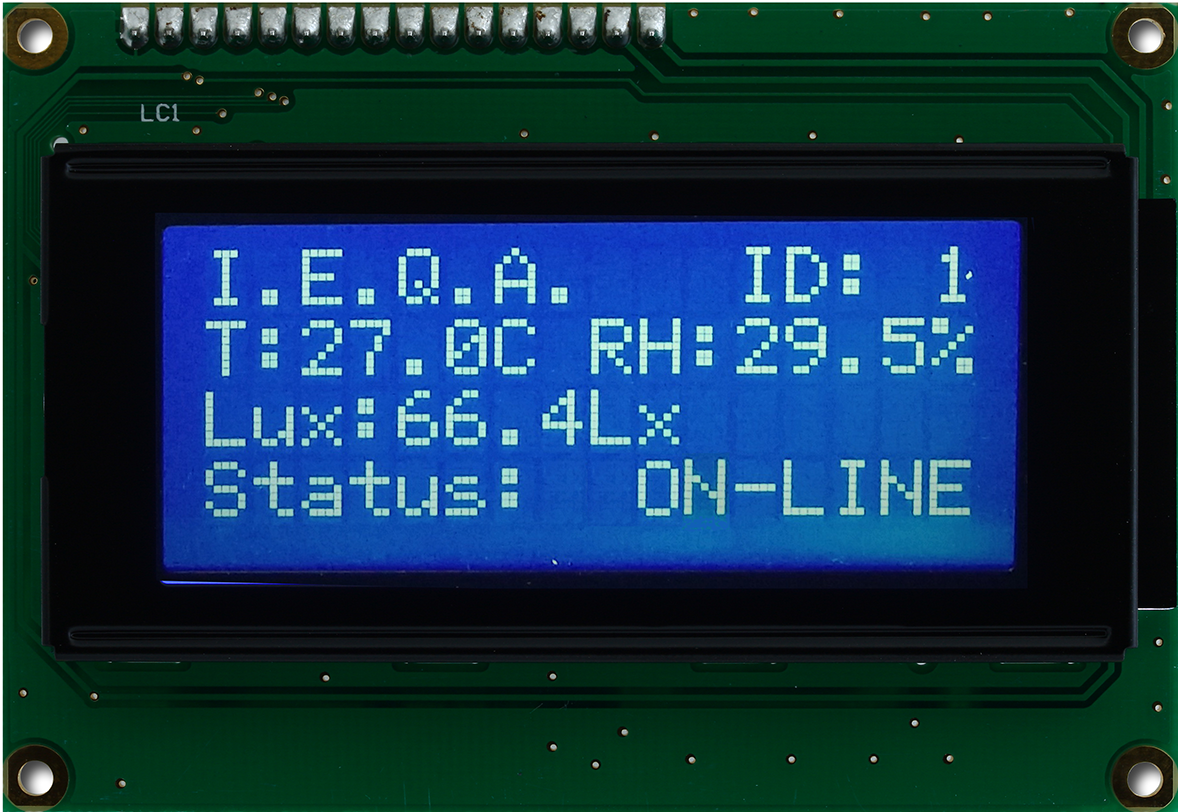
16x4 LCD blue backlight
This is a 16x4 character LCD with white text on a vivid blue background. This device has a compatible Hitachi HD44780 driver and can be fully controlled with only 6 digital lines. The LCD reports the operating conditions of the system, such as id station number, temperature, relative humidity, luminosity and connection status.
Schematic of a base station and the final prototype

Firmware
Note: this section does not provide a detailed explanation of the firmware and libraries but we provide all the source code, which is commented enough to be easily understood. For more details please see the Source code page.
Description
In this section there is a brief explanation of the Arduino Yún architecture and some technical specs (for more details see Arduino website), the structure of the firmware, the libraries used by the board to work properly and finally the main functions implemented.
Arduino Yún architecture and technical specs
In order to better understand how the board works, is reported a figure which sums up its internal architecture.

The Bridge library facilitates communication between the two processors, giving Arduino sketches the ability to run shell scripts, communicate with network interfaces, and receive information from the AR9331 processor. The USB host, network interfaces and SD card are not connected to the 32U4, but the AR9331, and the Bridge library also enables the Arduino to interface with those peripherals.
| Microcontroller | ATmega32U4 |
| Operating Voltage | 5 V |
| Input Voltage | 5 V |
| Digital I/O Pins | 20 |
| PWM Channels | 7 |
| Analog Input Pins | 12 |
| DC Current per I/O Pin | 40 mA |
| DC Current for 3.3V Pin | 50 mA |
| Flash Memory | 32 KB (of which 4 KB used by bootloader) |
| SRAM | 2.5 KB |
| EEPROM | 1 KB |
| Clock Speed | 16 MHz |
| Processor | Atheros AR9331 |
| Architecture | MIPS @400MHz |
| Operating Voltage | 3.3 V |
| Ethernet | IEEE 802.3 10/100 Mbit/s |
| WiFi | IEEE 802.11 b/g/n |
| USB Type-A | 2.0 Host |
| Card Reader | microSD only |
| RAM | 64 MB DDR2 |
| Flash Memory | 16 MB |
| SRAM | 2.5 KB |
| EEPROM | 1 KB |
| Clock Speed | 16 MHz |
Structure
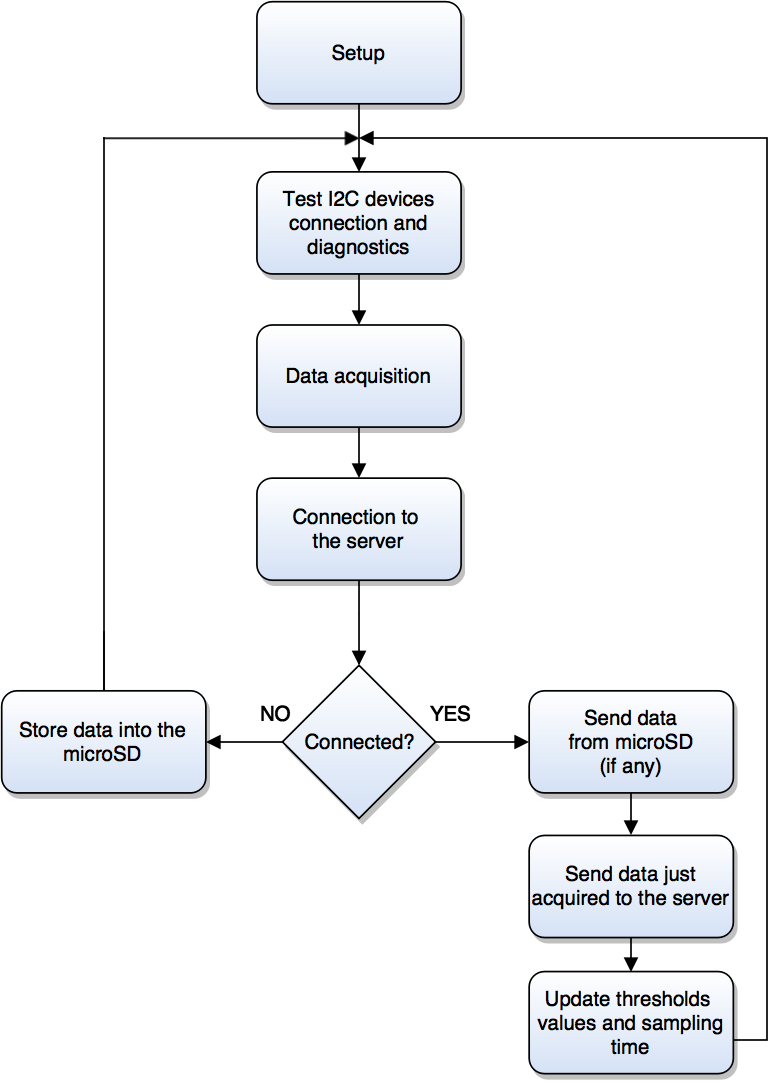
A sketch is the name that Arduino uses for a program. It's the unit of code that is uploaded to and run on an Arduino board. There are two special functions that are a part of every Arduino sketch: setup() and loop(). The setup() is called once, when the sketch starts. The loop() function is called over and over and is heart of the sketches.
Setup routine

Loop routine
Libraries
Bridge.h library:as mentioned above, this library allows the communication between the two processors previously described. Many classes of this library are used, here are reported some of them with a brief description:
FileIO.hused for read/write files on the microSD card;Mailbox.hwhich is an asynchronous, sessionless interface for communicating between Linux and Arduino;Process.his used to launch processes on the Linux processor, and other things like shell scripts;YunClient.hwhich is an Arduino based HTTP client;YunServer.hwhich is an Arduino based HTTP server;LiquidCrystal.h library:this library allows the board to control the Liquid Crystal Display (LCD) based on the Hitachi HD44780 chipset using 4-bit mode (4 data lines in addition to the rs, enable, and the rw control lines);
avr/pgmspace.h library:library that is available in the AVR architecture only, it allows the board to store data (constants) in flash (program) memory instead of SRAM (flash PROGMEM memory can only be populated at program burn time and it is not possible to change the values in the flash after the program has started running);
Wire.h library:this library allows the board to communicate with I2C/TWI devices, in particular the SDA (data line) and SCL (clock line) are on the pin 2 and 3 respectively (using the Arduino Yún);
TSL2561.h library:as previously described, the TSL2561 is a 16-bit digital (I2C) light sensor, with adjustable gain and 'integration time' (here has been chosen 16x gain for dim environment setted with a medium integration time). This library allows the board to communicate with the sensor via I2C bus (address 0x39) and to calculate Lux;
HTU21DF.h library:as previously described, the HTU21D-F is a 16-bit digital (I2C) humidity and temperature sensor. This library allows the board to communicate with the sensor via I2C bus (address 0x40) and to read sensor data;
Wire.h library:this library allows the board to communicate with I2C/TWI devices, in particular the SDA (data line) and SCL (clock line) are on the pin 2 and 3 respectively;
Main functions implemented
To better understand the main functions described below, a list of the main constants and global variables used has been reported:
...

/** Constants */
const short LCD_WIDTH  PROGMEM = 16;   // Maximum characters per line
const short LCD_HEIGHT PROGMEM =  4;   // Maximum height
const short SENSORS    PROGMEM =  3;   // Number of sensors
const short ITER       PROGMEM =  5;   // Number of iterations
const short ACTUATOR   PROGMEM =  6;   // Pin which is connected to the actuator
const short LEDr       PROGMEM = 13;   // On-board LED
const short BOARD_ID   PROGMEM =  0;   // Board ID

/* Default threshold values and sampling time */
const short TX_TIME  PROGMEM = 15000;  // Interval between loop routines
const short TEMP_MAX PROGMEM =    27;  // Maximum temperature
const short TEMP_MIN PROGMEM =    18;  // Minimum temperature
const short RH_MAX   PROGMEM =    70;  // Maximum humidity
const short LUX_MIN  PROGMEM =   100;  // Minimum lux

// For more details see /etc/config/network on the boards
#define IP_BOARD "192.168.43.10"
#define FILENAME "/mnt/sd/datalog.txt"

...

/** Global variables */
float s[SENSORS];                           // Data vector
HTU21DF htu = HTU21DF();                    // Create a HTU21DF object
TSL2561 tsl(TSL2561_ADDR_FLOAT);            // Create a TSL2561 object
LiquidCrystal lcd(7, 8, 9, 10, 11, 12);     // Initialize the library with the numbers of the interface pins
IPAddress server(192,168,43,100);           // IP address of the server on which there is the WS
YunClient client;                           // Cunstructor for the client
bool connection;                            // Status of the connection
short config;                               // Configuration status of the sensors

/* Threshold values and sampling time */
unsigned long threshold[5] = { TEMP_MIN, TEMP_MAX, RH_MAX, LUX_MIN, TX_TIME };

...
alarm:
this function checks if the acquired values are outside the reference range, then an actuator (here simulated by a LED) is activated/deactivated as follows: when the input is higher than a chosen threshold, the output is high and the actuator will be activated, whereas when the input is below a different (lower) calculated threshold the output is low and the actuator will be deactivated, and when the input is between the two levels the output retains its value and the actuator retains its status (see the figure);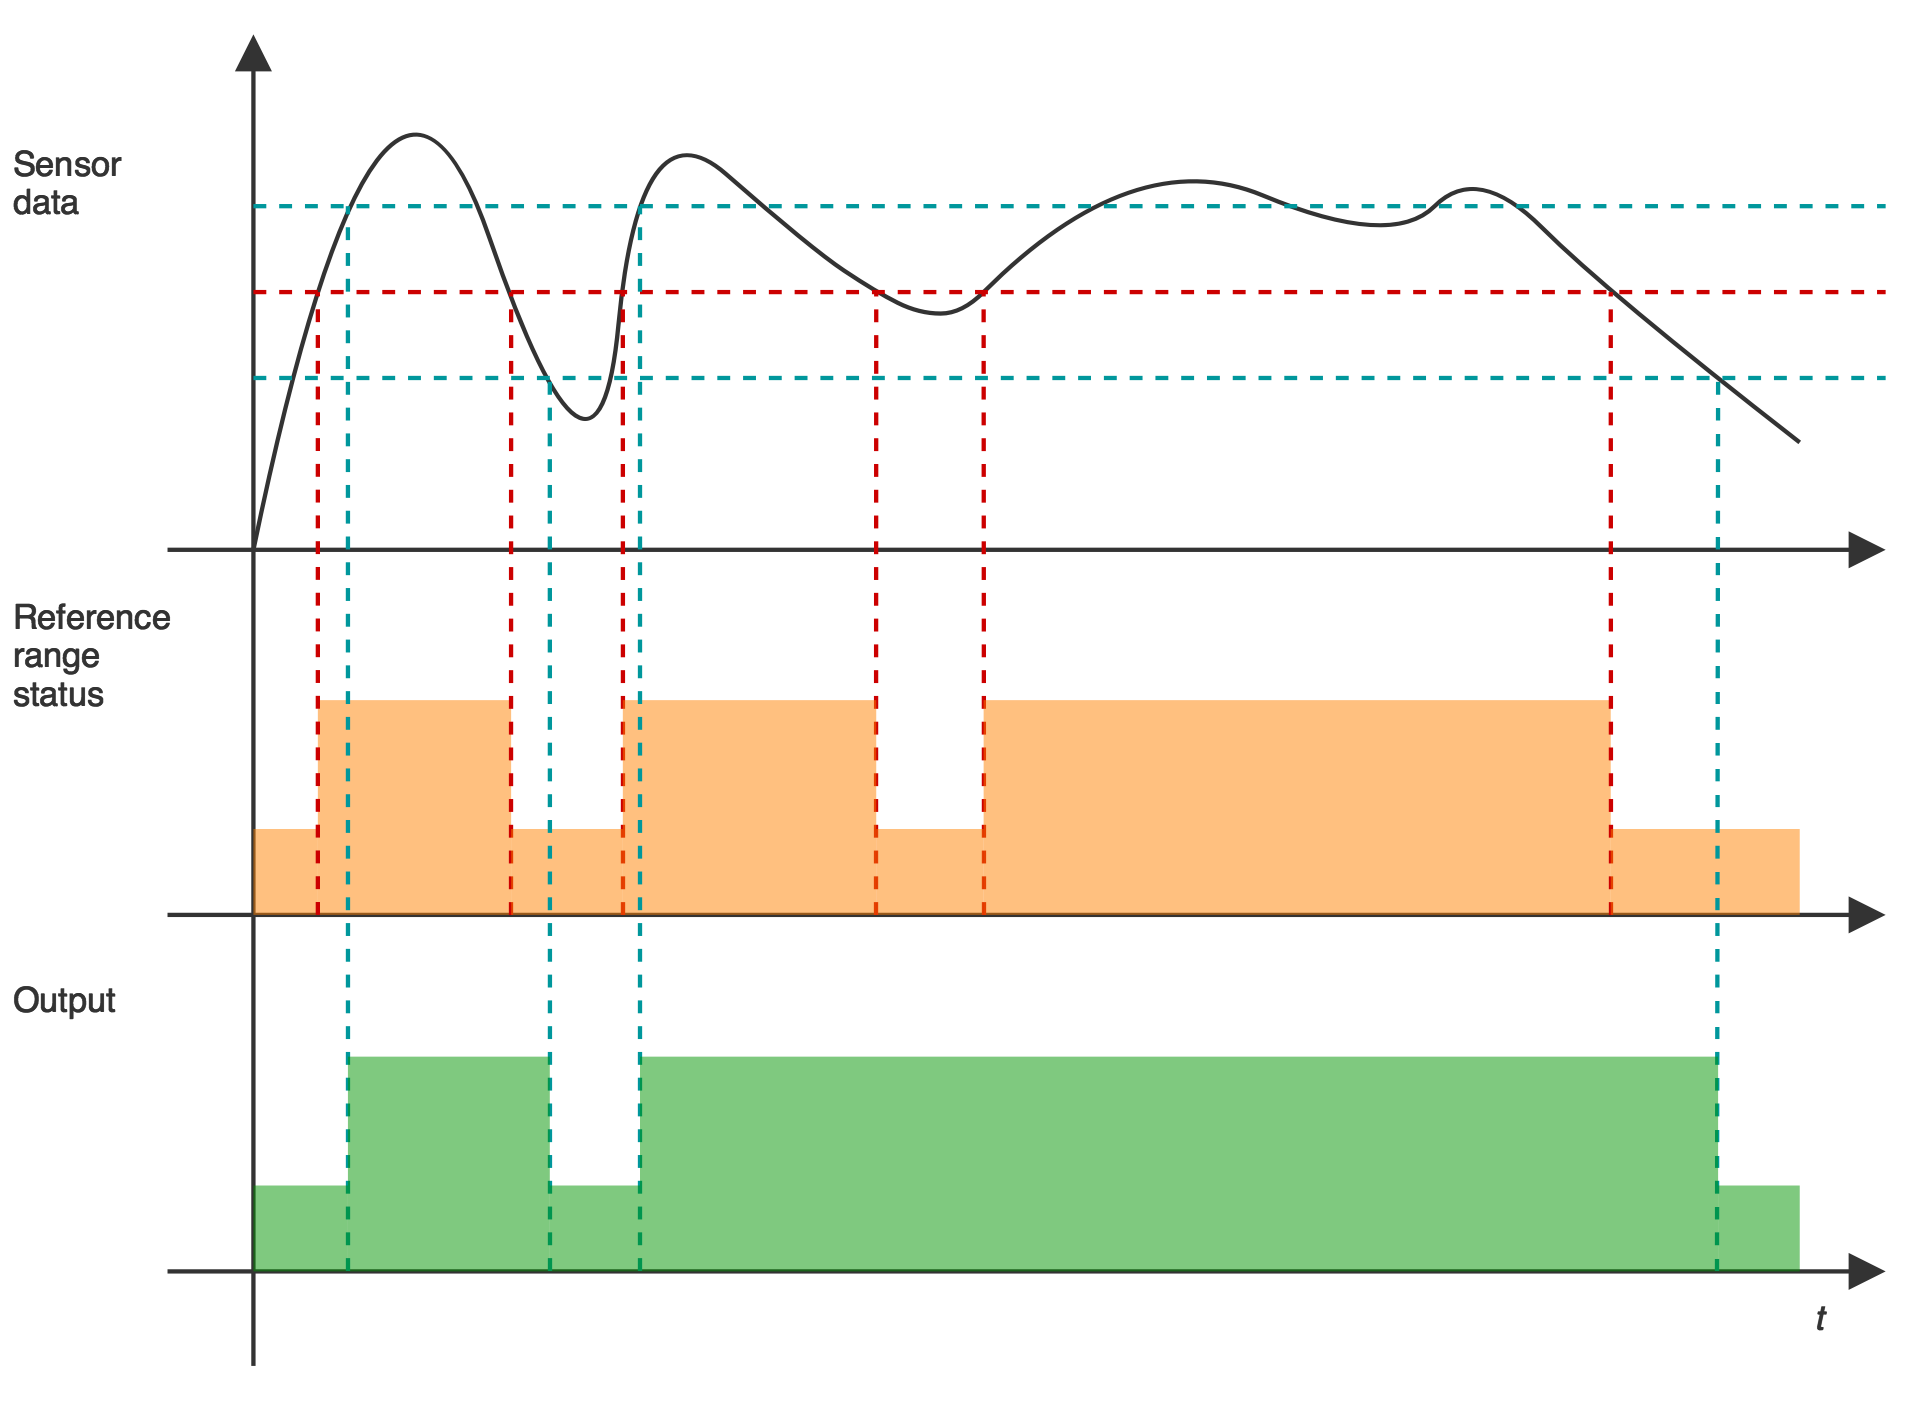
data_acquisition:this function calculates the average of N consecutive acquired values (for stability) for each sensor, thus the values are concatenated into a string as follows:
data ="s0=xx.xx&s1=xx.xx&s2=xx.xx&board=X&time=xxxxxxxxxxx", where the time is given by theget_timefunction (described below);get_data:this function allows the board to retrieve information from the given server using using the HTTP GET request in order to edit the threshold values and sampling time. The format of the GET request is as follows:
"GET /ieqa/"+ method + BOARD_ID +"HTTP/1.1"
"Host: "+ IPAddress
"User-Agent: Arduino/1.0"
"Connection: close"
where method is a string that identifies what needed by the board, e.g. could be"get_time/"to synchronize the clock with the server, or"get_threshold_values/"to update the threshold values.get_time:function that returns the timestamp given by launching a process which execute the following linux (Linino) shell command:
"date +%FT%T"(whose output isyyyy-mm-ddThh:mm:ss);I2C_devices_init:function that initializes the communication on I2C bus for all I2C devices (luminosity sensor on address 0x39 and the temperature and humidity sensor on address 0x40);
I2C_devices_test:test of the I2C devices on bus (the function returns 0 if the devices work properly, otherwise it returns 1 if TSL2561 doesn't work, 2 if HTU21DF doesn't work or 3 if both sensors don't work properly);
network_connection:connection attempt to the target IP address passed as parameter, the function returns 1 if the connection has been successfully established, otherwise it returns 0;
network_test:function that tests the network connection, if the server is disconnected (the client is disconnected) it returns 1, otherwise it returns 0;
post_data:similar to the previous function
get_datawith the difference that this function posts the data to the server. The format of the POST request is as follows:
"POST /ieqa/insert_data HTTP/1.1"
"Host: "+ IPAddress
"User-Agent: Arduino/1.0"
"Connection: "+ method
"Content-Type: application/x-www-form-urlencoded;"
""Content-length: "+ data.length()
data
where method is a string that identifies the type of connection (e.g."close"or"keep-alive"),data.length()is the length of the data acquired, and data is a string with the data to post;send_from_microSD:function that sends data stored into microSD (path:
"/mnt/sd/datalog.txt") to the server (using thepost_datafunction with method setted as"close"). When the data are sent, the function removes the file stored into the microSD card;send_to_server:function that sends data (acquired or stored into the microSD card) to the server by using
post_datafunction;set_clock:function that syncronizes the internal clock of the Linino side with the server executing the following shell command:
"date --set '"+ server_clock +"'", whereserver_clockcontains the time clock of the server;set_data_from_server:function that gets data (thresholds or sampling time) from server by using
get_datafunction (with method setted properly) and it modifies the relative values;store_into_microSD:function that stores the acquired data into the microSD in the following file:
"mnt/sd/datalog.txt". Each entry in the file is equivalent to a string of 51 bytes which identifies the values acquired by the base station, the time of the acquisition and the identification number of the base station itself. Given for instance a microSD card of just 1 GB, it is possible to store: 1 GB / 51 B = 230 / 51 = 21053761 entries. Thus, considering the maximum sampling rate (minimum sampling time) it is possible to store 121 months of acquisitions with a sampling time of 15 s.
Web application
Note: this section does not provide a detailed explanation of the software, configuration of the server and setup of the framework but we provide all the source code, which is commented enough to be understood. For more details please see the Source code page.
Server
The implementation of the website, which runs on a virtual Linux distribution (ubuntu server with LAMP web service solution stack configured properly), it has been based on a software architectural pattern named Model–View–Controller (MVC) which is implemented on the CodeIgniter Web Framework. In the following sections there is a brief explanation of the CodeIgniter's classes and functions to query the database - current supported ones are MySQL (5.1+), MySQLi, Oracle, Postgres, MS SQL, SQLite, CUBRID, Interbase/Firebird and ODBC - tables containing items, updating them and displaying them on the views. For this, it has been created a Controller, a Model and some Views, as well as the database to hold the information (although the latter part will also be assumed, thus only a brief description is reported).
Database
The database requirements are as follows:
-
a table called "sensors" which contains 6 columns
id (primary and auto incremented), timestamp (timestamp of the acquistion), s0 (acquired value of temperature), s1 (acquired value of relative humidity), s2 (acquired value of brightness/luminosity), board (id of the board which have sent data).
Name Type Length Default Attributes Auto increment Comments id INT 5 None unsigned Yes primary key timestamp INT 15 None unsigned No time s0 DECIMAL 6,3 None unsigned No temperature [Celsius] s1 DECIMAL 6,3 None unsigned No relative humidity [%] s2 DECIMAL 6,3 None unsigned No luminosity [lux] board INT 1 None unsigned No board id -
a table called "thresholds" which contains 6 columns
board (unique id of the board), t0 (minimum temperature threshold value of the board), t1 (maximum temperature threshold value of the board), t2 (maximum relative humidity threshold value of the board), t3 (minimum luminosity threshold value of the board), t4 (sampling time of the board).
Name Type Length Default Attributes Auto increment Comments board INT 1 None unsigned No unique key t0 DECIMAL 6,3 None unsigned No min. temperature [Celsius] t1 DECIMAL 6,3 None unsigned No max. temperature [Celsius] t2 DECIMAL 6,3 None unsigned No max. relative humidity [%] t3 DECIMAL 6,3 None unsigned No min. luminosity [lux] t4 INT 10 None unsigned No sampling time
MVC
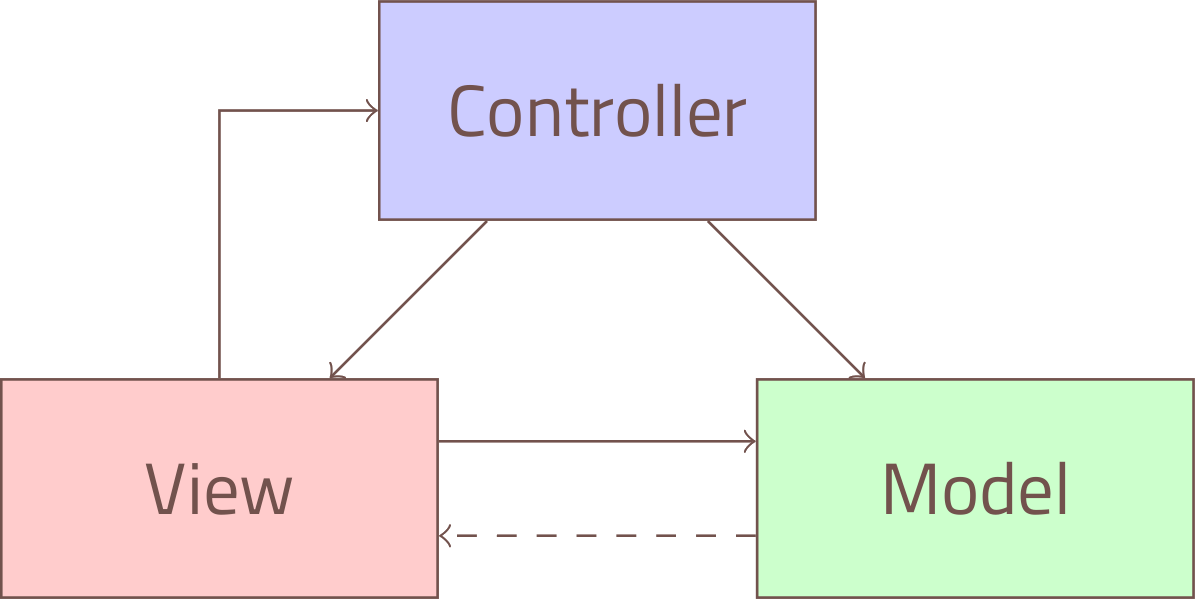
The MVC architecture implemented on the CodeIgniter Web Framework divides a given software application into three interconnected parts, so as to separate internal representations of information from the ways that information is presented to or accepted by the user. The three parts of the MVC are the follows:
- Model
- captures the behavior of the application in terms of its problem domain, independent of the user interface. In other words it manages the "knowledge", i.e., data.
- View
- "visual" representation of the model, extracts data from the model and updates it.
- Controller
- (conceptual) link between the user and the system, manages the user input and instructs the view(s) for answering the user's request.
Architecture
The following graphic illustrates how data flows throughout the system (MVC implementation in CodeIgniter):
- index.php is a generic (external) controller: it initializes the resources needed by CI;
- the router examines the HTTP request and decides which controller should serve it (if the response to the current request is present in a cache, it will be immediately emitted);
- the HTTP request is filtered by the security module before sending it to the application controller;
- the controller loads the resources needed for processing the request and (possibly) instructs the model accordingly;
- the view is invoked for generating the content to be returned to the browser (possibly, this content is stored in the cache).
- application
- cache, config, controllers, core, errors, helpers, hooks, language, libraries, logs, models, views;
- assets
- css, fonts, js;
- system
- core, database, fonts, helpers, language, libraries;
- MODEL
- sensors.php;
- CONTROLLER
- ieqa.php;
- VIEWS
- analytics.php, dashboard.php, db_empty.php, error.php, footer.php, graphs.php, header.php, home.php, info.php, options.php, report.php, statistics.php.

The model
Model is the place where it is possible to retrieve/insert/update information in the database or other data stores, thus it has to do with connecting to the database in order to performing Create, Read, Update and Delete operations.
Model and controller contain an uppercased constructor, which bears the same name as the page itself.
The model has its own functions which can be called as soon as a specific instance of the given model has been created.
A list of the methods implemented in the model follows:
__construct():constructor method which loads the database;
is_not_empty($table):method that returns 1 if the query to the database table passed as parameter returns a number of entries greater than 0 (in other words if is not empty);
get_all():method that makes a query to the database in order to return all the informations in the
`sensors`table for both the boards;get_json_table($board):similar to the above method but it returns the data in JSON format and for a specific board;
get_json_graphs($board):method that returns in JSON format all the informations to implements graphs for a specific board;
get_json_statistics($par):method that returns in JSON format all the statistics (minimum, maximum, expected value, variance, standard deviation, coefficient of variation, lower quartile, median, upper quartile and interquartile range) about a specific sensor passed as parameter for both the boards;
get_thresholds($board):method that returns in JSON format the threshold values stored in the database table
`thresholds`for the selected board. If there isn't an entry in the table for the selected board, then the method returns the default threshold values;insert_data_into_db():method that inserts data posted by the boards (i.e. temperature, relative humidity, luminosity and timestamp), into the database for the selected board (making use of HTTP POST method);
make_report($temp, $rh, $lux):method that generates the report in HTML code with statistics, boxplots, network configuration etc. elaborating the JSON data of each sensor contained into the variables passed as parameters;
update_samp_time():method that updates the sampling time into the database for the selected board (making use of HTTP POST method), in particular the method returns 1 if the sampling time of at least one board has been modified, otherwise it returns 0;
update_threshold_values():method that updates the threshold values into the database for the selected board (making use of HTTP POST method), in particular the method returns 1 if at least one threshold value of a board has been modified, otherwise it returns 0.
The controller
The controller's structure resembles that of the model but the controller connects the back end and the front end, hence it will call the methods inside the model to output what it needs to display to a view.
All database-related functions in CodeIgniter are set and called using the model, the front end is displayed and managed by the view instead.
In brief, the controller creates a new instance of the model, does certain functions and passes the results to the view so as to display them on the web browser.
A list of the methods implemented in the controller follows:
__construct():constructor method which loads the model, URL Helper library (which contains functions that assist in working with URLs) and Sessions library (which permits to maintain a user's "state" and track their activity while they browse the website);
index():method that loads the home page if the controller is invoked;
home():method that loads the home view;
dashboard():method that loads the dashboard view if the query of the model method
is_not_empty('sensors')returns 1 (the table is not empty), else it loads the error view (no data available);analytics():method that loads the analytics view if the query of the model method
is_not_empty('sensors')returns 1 (the table is not empty), else it loads the error view (no data available);graphs():method that loads the graphs view if the query of the model method
is_not_empty('sensors')returns 1 (the table is not empty), else it loads the error view (no data available);statistics():method that loads the statistics view if the query of the model method
is_not_empty('sensors')returns 1 (the table is not empty), else it loads the error view (no data available);report():method that loads the report view if the query of the model method
is_not_empty('sensors')returns 1 (the table is not empty), else it loads the error view (no data available);options():method that loads the options view;
info():method that loads the info view;
generate_report():if the HTTP request method is not equal to POST loads the error view (this method cannot be invoked directly), else this method invokes the
get_json_statistics($par)for each sensor and stores the returned JSON data into three variables, then it passes them to the model methodmake_report($temp, $rh, $lux)which returns the report in HTML format to the view;json_data_table($board):method that calls the
get_json_table($board)method in the model in order to return the data to the view for a specific board;json_data_graphs($board):method that calls the
get_json_graphs($board)method in the model in order to return the data to the view for a specific board;json_data_statistics($par):method that calls the
get_json_statistics($par)method in the model in order to return the data to the view for a specific sensor;edit_samp_time():if the HTTP request method is not equal to POST loads the error view (this method cannot be invoked directly), else this method invokes the
update_samp_time()which returns 1 if the sampling time into the database has been modified by the model, otherwise it returns 0;edit_threshold_values():if the HTTP request method is not equal to POST loads the error view (this method cannot be invoked directly), else this method invokes the
update_threshold_values()which returns 1 if at least one threshold value of a board has been modified, otherwise it returns 0;empty_table():if the HTTP request method is not equal to POST loads the error view (this method cannot be invoked directly), else this method makes a
TRUNCATEof the`sensors`table, in order to delete all the entries available in the database table;data_available($board):method that returns 0 if there are no data available in the
`sensors`table for the selected board;ping($host):method that makes a ping request used to test the reachability of a specific host (e.g. a board). The function returns 1 if the target host send in response to the ICMP Echo Request an ICMP Echo Reply, otherwise returns 0;
get_time():if the HTTP request method is not equal to GET loads the error view (this method cannot be invoked directly), else this method returns the unix timestamp of the server to the board (used to synchronize the clocks between board and server);
get_threshold_values($board):if the HTTP request method is not equal to GET loads the error view (this method cannot be invoked directly), else this method returns the alarm threshold values and sampling time (used to update the values of the boards);
insert_data():if the HTTP request method is not equal to POST loads the error view (this method cannot be invoked directly), else this method calls the
insert_data_into_db()model function in order to add an entry into the`sensors`table with the values posted by the boards.
The quality index calculated it is based on the Heat Index (HI), which is obtained by multiple regression analysis by considering the values of temperature and relative humidity, and the Luminosity-Brightness Index (LBI) that provides an index based on the detected brightness and taking into account the UNI EN 12464.
The LBI index, instead, is a measure of how different (in percentage) are the observed value and the reference value. The latter has been setted to 500 lux in accordance with the existing legislation. The heat index, also known as the apparent temperature, is what the temperature feels like to the human body when relative humidity is combined with the air temperature. This has important considerations for the human body's comfort. When the body gets too hot, it begins to perspire or sweat to cool itself off. If the perspiration is not able to evaporate, the body cannot regulate its temperature. Evaporation is a cooling process. When perspiration is evaporated off the body, it effectively reduces the body's temperature. When the atmospheric moisture content (i.e. relative humidity) is high, the rate of perspiration from the body decreases. In other words, the human body feels warmer in humid conditions. The opposite is true when the relative humidity decreases because the rate of perspiration increases. The body actually feels cooler in arid conditions. There is direct relationship between the air temperature and relative humidity and the heat index, meaning as the air temperature and relative humidity increase (decrease), the heat index increases (decrease).
The function that makes the computation it is the result of a multivariate fit to a model of the human body based on the papers R.G. Steadman, 1979. "The assessment of sultriness. Part I: A temperature-humidity index based on human physiology and clothing science", J. Appl. Meteor., 18, 861-873 and Lans P. Rothfusz. "The Heat Index Equation (or, More Than You Ever Wanted to Know About Heat Index)", Scientific Services Division (NWS Southern Region Headquarters), 1990.
This equation reproduces the NOAA National Weather Service (NWS) table (except the values at 90 °F and 45 &percent;/70 &percent; relative humidity vary unrounded by less than -1/+1, respectively). Thus, given the ambient temperature in degrees Celsius (converted in degrees Fahrenheit) and the relative humidity in percentage, the function calculates the index as follows:
where T = ambient dry bulb temperature (°F), H = relative humidity (integer percentage).
Constants for equation that is within 3 degrees of the NWS master table for all humidities from 0 to 80% and all temperatures between 70 and 115 °F and all heat indexes < 150 °F, are:
- c1 = 0.363445176,
- c2 = 0.988622465,
- c3 = 4.777114035,
- c4 = -0.114037667,
- c5 = -0.000850208,
- c6 = -0.020716198,
- c7 = 0.000687678,
- c8 = 0.000274954,
- c9 = 0.000000000.
The views
The view outputs information that the controller passes to it.
A view resembles a regular HTML page with doctype, head and body tags where header and footer views are loaded before and after the content view to be displayed; in fact views can flexibly be embedded within other views.
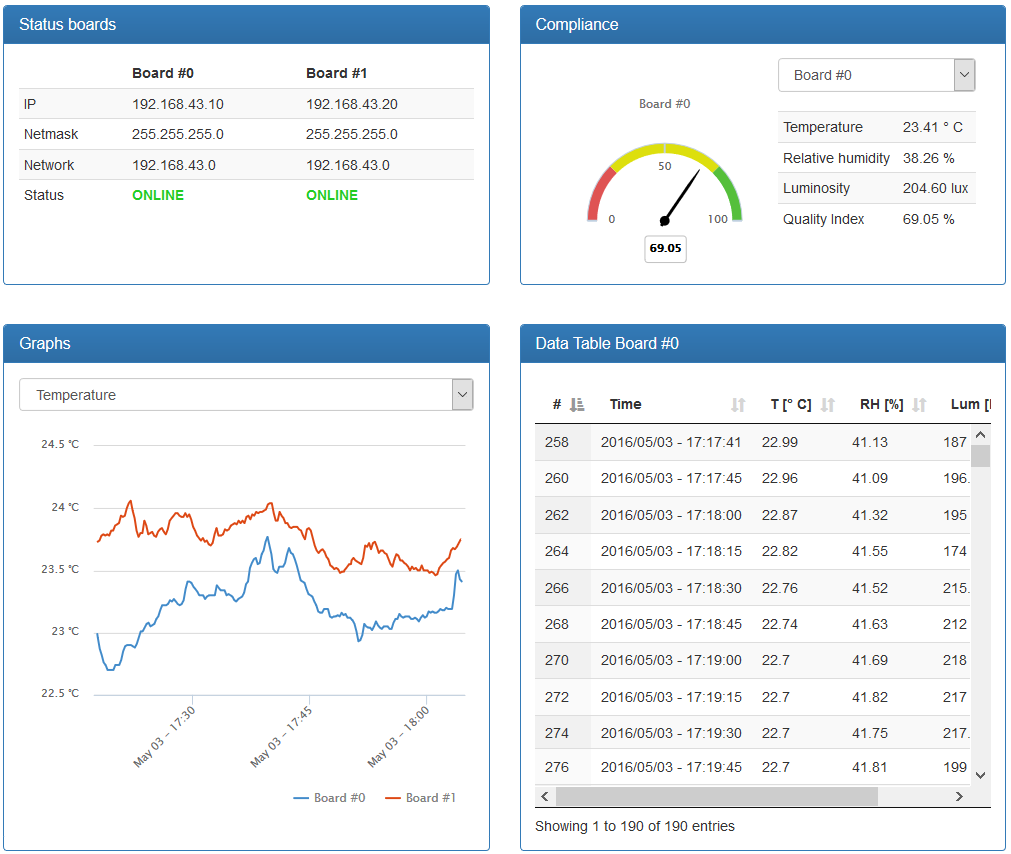
Since there are a lot of views, here has been reported a list of the main views implemented with a brief description and a screenshot of the view itself:
dashboard():View that uses charts and tables to illustrate the most important informations.
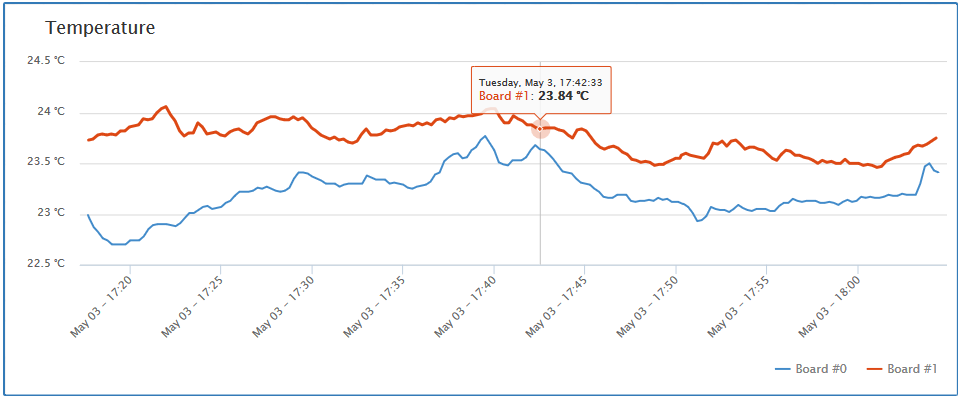
graphs():View that uses graphs to analyze data. When the mouse is over the graph, detailed informations about the acquisition are shown.
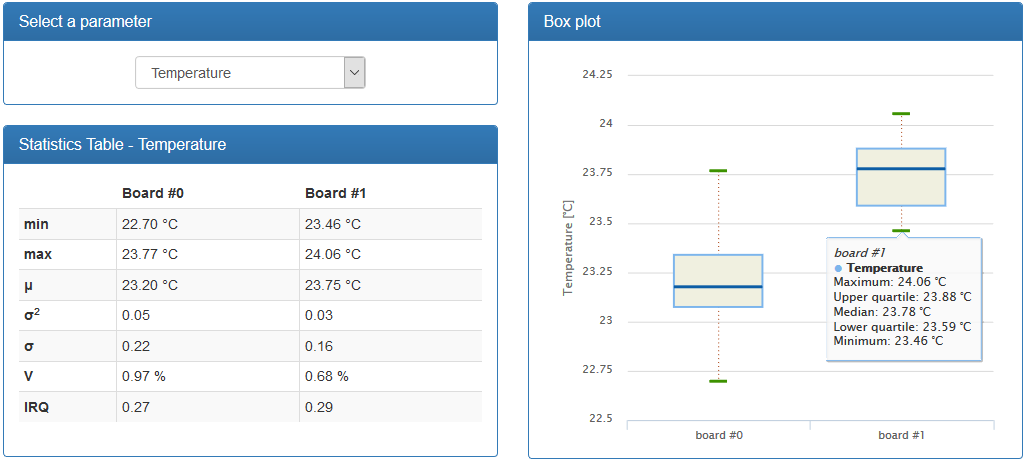
statistics():View that uses statistics and graphs (i.e. box-and-whisker plots) to make statistical analysis of data. When the mouse is over a box, detailed informations about the statistics are shown, such as: minimum, 1st quartile, median, 3rd quartile, maximum.
options():View that allows a user to delete all the values acquired or to edit various options, such as threshold values and sampling rate both on a specific board.
